
When it comes to global warming, debate often takes the form of lies, damned lies and statistics. But the truth is sometimes even less appealing, particularly when you consider what it really might mean for the environment. Geoff Russell explains.
How to lie with statistics by Darryl Huff was first published in 1954 and is a bit of a legend in statistical circles. The modern and very recent equivalent is How charts lie by Alberto Cairo; it’s a significant step forward.
The goal of both books is to alert the general public to the tricks of people who use data to spread falsehoods; either through ignorance, thoughtlessness, dishonesty or malice.
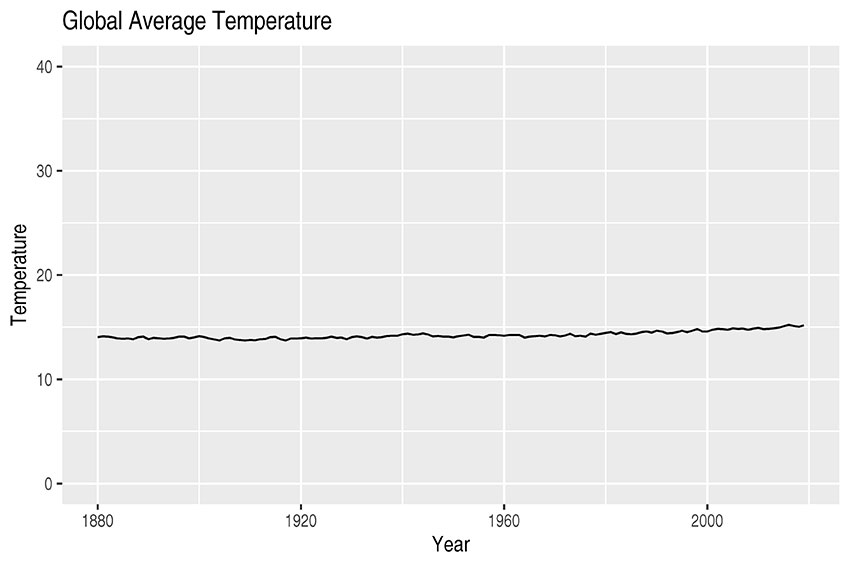
Here’s a little example. Huff’s book is famous for telling people that all graphs should start have axes starting at zero. Cairo has some beautiful illustrations explaining why this is wrong. Here’s a graph of global temperature with the y axis ranging from 0 to 40 degrees centigrade. Global warming pretty much vanishes.

Now here’s a typical, more informative, graph that shows you exactly what is happening. Instead of average temperature, it just shows the change relative to the average temperature during the period 1951-1980 (14.2 degrees C). Both graphs show the same data from the NASA temperature record.
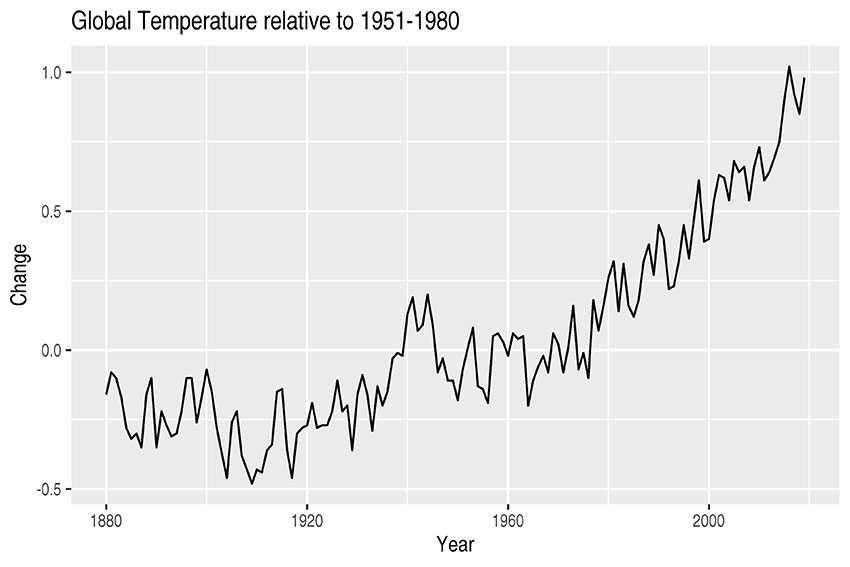

The reason that this graph is informative, honest and accurate is that tiny numerical changes in average temperature do indeed drive huge changes on the ground; not least because a 1 degree global average won’t ever be uniform over the globe, but will indicate about 3 degrees (C) at either pole; don’t ask why, that’s just the physics. The point being, small changes need to be visible and proportional to the impact; not hidden.
Renewable energy advocates frequently channel this trick to sell their message. I’m not claiming any malice or deliberate dishonesty on their part; I’ve made the same mistake myself! But here’s how it goes.
In a Twitter exchange with Simon Holmes à Court I made some claims about the land required to replace our Liquid Natural Gas (LNG) exports with ammonia generated by solar electricity. We currently export 66 million tonnes of LNG, but we know we have to stop, and quickly.
simple energy peace package:
• lift the ban on nuclear
• put a price on domestic CO₂
• science based emission target
• remove all other energy subsidiescould you get behind that @Adam_Creighton? https://t.co/bz2oneJSgx
— 💧simon holmes à court (@simonahac) February 18, 2020
Ideally we’d replace it with a similar amount of energy, otherwise the countries who are importing that LNG will need alternatives; preferably not LNG from any source!
But we’d need about 191 million tonnes of ammonia to replace 66 million tonnes of LNG and if we generated that with solar farms like that at Nyngan in NSW, then we’d need, at current efficiencies about 9,000 Nyngans covering 2.2 million hectares. Even at the best possible efficiencies, we’d need more than 7,000 Nyngans.
Almost instantly, Simon @simonahac and @GavinMatheson replied with maps. Here’s Simon’s map; Gavin’s was similar.

Simon’s comment was intended to emphasise how terribly small this area was: “1/3 the size of the fires”. Gavin’s comment was “it looks like we can squeeze this in”.
Now focus on Simon’s map; and think about 1 percent of the area. One percent would be a very small few pixels on the map, but roughly 25,000 hectares on the ground. This is the area burned by the Cudlee Creek fire in South Australia. Looking at it as a tiny part of the square box on Simon’s map might lead you to ask: “Is that all? What were those wimps at Cudlee Creek whinging about?”.
But nobody would do that, not Simon, not Gavin, nobody. Because we all understand what one burned out home looks like. We all understand a 100-metre soccer pitch and 100×100 is a hectare. We know what it looks like when it’s burned and we know what it’s like to bulldoze even that small area.
Do it 250 times and you have a single Nyngan sized solar farm; just add 1.35 million panels and a mass of steel posts. Now do it 9,000 times. And each time you do it, you should do an environmental survey of the animals and plants on that area.
The recent estimate of 1 billion animals killed in the fires is based on about 167 animals per hectare. Covering 2.2 million hectares in 12 billion panels isn’t quite equivalent to a fire, but it’s a major transformation to the habitat. It’s far worse than anything even the worst nuclear power plant accident could ever do to even a few thousand hectares.
The area around Chernobyl is a fecund wildlife reserve; with human occupants also. Some people just refused to leave back in 1986. If you really want environmental damage to 2.2 million hectares, then you’d be hard put to do worse than cover it with a solar farm.
Simon’s map is deeply misleading; not born of malice, but from not thinking about it. As I said earlier, I’ve done it myself.
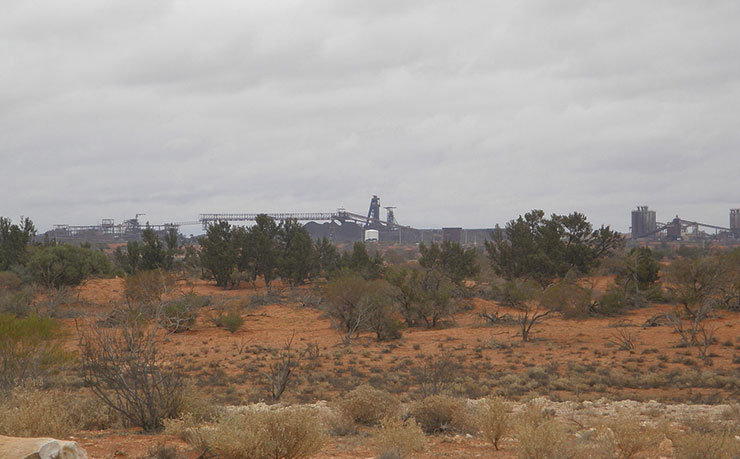
We could alternatively supply the same amount of energy (measured thermally) to the countries taking most of our LNG, which are China, South Korea and Japan, using uranium. Olympic Dam, if suitably expanded, could supply the entire amount without much difficulty at all. How much uranium would supply the same thermal energy as 66 million tonnes of LNG per year? 8,200 tonnes. And if you used fast neutron reactors like that which Bill Gates is funding? About 82 tonnes!
Olympic Dam is a copper mine, producing 230,000 tonnes per year, plus about 4,000 tonnes of uranium. As mines go, it’s huge at 1,400 ha. As solar farms go, it’s tiny; about 6 Nyngans.
There is an area in Sydney, Kelly’s Bush, not far from where I grew up. It’s about 7.7 hectares and the fight to stop it being cleared during the 1970s is considered by some to mark the beginning of the modern environmental movement in Australia. It’s ironic that many who now see themselves as environmentally concerned are totally non-plussed by the thought of covering 2.2 million hectares with concrete, steel and something like 12 billion solar panels. And we haven’t even talked about the area to mine the materials and construct the factories to make those panels.
Our environmental movement has simply lost its way. It has lost touch with environmental scientists who are generally pro-nuclear. They think quantitatively, they understand energy density, and the importance of habitat for wildlife. But the populist movements? They are too ingrained in old ideologies, locked into the 1960’s view of DNA, radiation and cancer; 60-years out-of-date on genetic engineering, nuclear science.
Robyn Williams blew the whistle on nuclear fear mongering on the ABC Science show just recently. He should have and could have done it years ago; it seems to have been the astonishingly misleading docu-drama Chernobyl that finally got him thinking. Better late than never.
But what about the waste?
All energy sources have waste streams. Consider them objectively and the nuclear stream is easily the smallest, and all of its technical problems were solved decades ago. If Bill’s reactors get up, then the waste problem will go from small to micro.
In contrast, solar farms have bigger waste streams with significant unsolved technical problems. Covering 2.2 million hectares in panels isn’t just a travesty, it’ll make that waste stream much, much bigger.
Donate To New Matilda
New Matilda is a small, independent media outlet. We survive through reader contributions, and never losing a lawsuit. If you got something from this article, giving something back helps us to continue speaking truth to power. Every little bit counts.


