 On Alan Finkel’s Big Battery Adventure")
The debate over Australia’s energy requirements rages on. Geoff Russell weighs in on a crucial report dropped last month.
About 10 minutes into Chief Scientist Alan Finkel’s speech to the National Press Club following the launch of his long awaited report, Blueprint for the Future: Independent Review into the Future Security of the National Electricity Market, he said:
“Repurposing [mobile phone]batteries has enabled manufacturers to configure grid scale batteries. These are now being deployed internationally at a level and cost that were unimaginable 5 years ago.”
Some things can be true, but nevertheless misleading. Finkel sees a big role for batteries in helping Variable Renewable Energy (VRE) sources, like wind and solar, to meet what he calls a Generator Reliability Obligation (GRO). Finkel understands the security problems of our grid very well. Security here means freedom from load shedding, blackouts, damaging frequency and voltage swings.
Traditionally, baseload generators were huge lumps of spinning metal whose inertia dampened the response of the system to people turning on machines, air-conditioners and the like. This was so much a part of the system that these attributes were little recognised.

These days, inertia and frequency control are considered as special needs which can’t be taken for granted but must be provided. It’s like owning a vehicle and taking its availability for granted. But … when you don’t own one, the response time of taxis or ubers or the borrowing of a mate’s vehicle becomes a crucial quantity which you have to be concerned about and manage.
‘Availability’ may even spawn special deals like: “Do you want to pay $20/month to have a guaranteed 5 minute taxi/uber response time?” Such questions have no meaning when you own a vehicle. With electricity systems, once you switch to things like wind and solar, you need other ways of providing the features that were an automatic part of large centralised spinning generators. There is now even a special name for these things: ancilliary services.
Finkel’s scheme for providing these ancilliary services is to push the responsibility onto anybody proposing to attach a VRE to the grid. In essence he is proposing that wind and solar farms use storage technologies to make themselves look more like baseload systems. After all, we want and need electricity that just works, regardless of the hour of the day or how windy it is. And we don’t want a blackout just because a crowd of people simultaneously got home from work on a hot evening and turned on the air-con.
Are batteries up to the task?
Finkel’s modelling just presumes that we can have whatever we want and that supply will magically ramp up to satisfy demand while also delivering the kind of price decreases we want.
The US Department of Energy keeps a global energy storage database in which it keeps records of significant battery projects. We can use it to assess the size of the bet that Finkel is asking us to make. Globally, VRE advocates are calling for precisely the same bet to be placed with the consequences of failure being runaway climate change. It’s quite a bet.

There are currently 1,636 energy storage projects listed in the dataset. Lots of small experimental projects and over 100 years of pumped-hydro electricity schemes, which are also classed as energy storage projects. The data isn’t perfect, there are quite a few projects in the database without Duration data (415). Meaning there is data on the rated power a battery can deliver, but not for how long. I’ve replaced this missing data with the average for other projects with the same technology.
For each project we can multiply the power by the duration to find the total energy that the battery can supply at one time. Then we can accumulate the energy for each type of battery. The result is in the following table. The median and average columns show how small most projects are.
And what of the total storage capacity? It’s just over 3 GWh. This is enough to cover the electricity short-fall from a single South Korean APR1400 nuclear reactor going off-line for just 2 hours.
| Type | N | MedianProject (MWh) | Mean Project (MWh) | Total GWh |
| Lithium-ion Battery | 442 | 0.48 | 6.82 | 3.06 |
| Lithium Ion Titanate Battery | 20 | 0.66 | 3.18 | 0.06 |
| Lithium Iron Phosphate Battery | 121 | 0.19 | 2.72 | 0.33 |
| Lithium Manganese Oxide Battery | 2 | 0.55 | 0.55 | 0.00 |
| Lithium Nickel Cobalt Aluminum Battery | 3 | 0.92 | 1.00 | 0.00 |
| Lithium Nickel Manganese Cobalt Battery | 12 | 2.48 | 3.60 | 0.04 |
| Lithium Polymer Battery | 21 | 0.30 | 0.56 | 0.01 |
| Lithium-titanate | 1 | 0.25 | 0.25 | 0.00 |
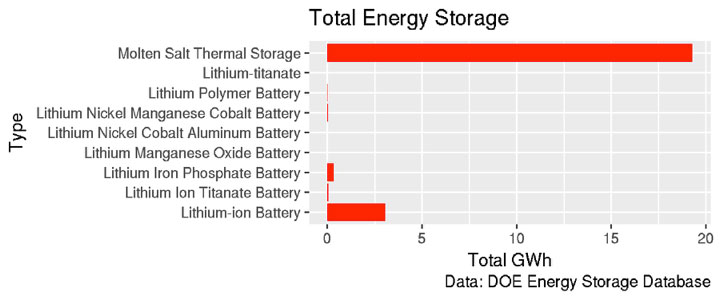
| Molten Salt Thermal Storage | 41 | 375.00 | 470.44 | 19.29 |
Perhaps Finkel is right, perhaps the battery rollout is larger than imaginable a few years back, but tiny is still tiny.
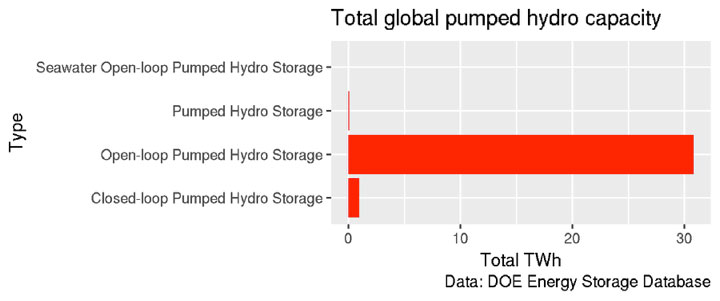
The last row of the table is molten salt storage. This technology has been around longer than the “big” lithium and has a correspondingly larger total capacity. Each project is also much bigger. Here’s the same data in a graphical form which makes the difference obvious. Why did Finkel mention phone batteries when molten salt capacity is so much bigger?
What are these big lithium based batteries predominantly being used for?
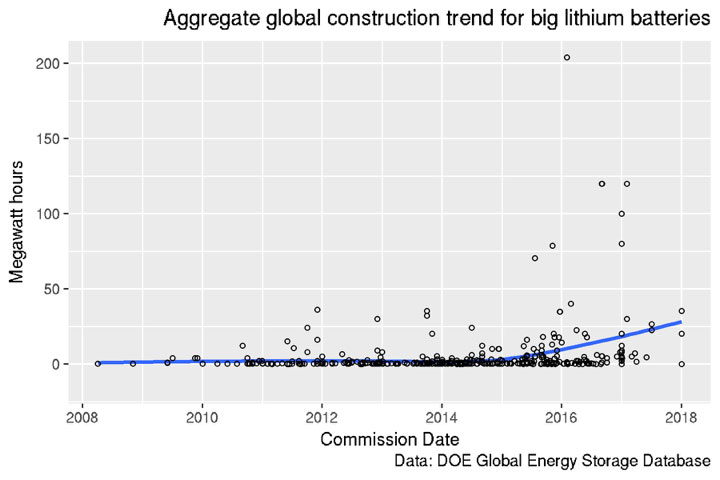
If we think about the 12 hours or more of battery storage you’d need to give a solar farm some hope of providing energy 24×7, then a 20MW solar farm would need a battery with a power rating of 20MW and an energy capacity of 240MWh. The graph below shows every project in the database. The date is the Commissioning Date if that is known, or the Construction Date. If neither date is known, then the battery is ignored. Looking at the graph, we see very few batteries over 10MWh, indicating that they are mostly being used for either frequency control, or perhaps to handle minor load fluctuations. They are clearly not being used to turn solar farms into 24×7 electricity supplies.
The growth is clearly trending upwards, but how fast is this growth compared to what we might want?
Recall that I removed projects without date information. There’s quite a few (210) so I need to check that I haven’t missed something important by removing them. They are detailed in the following table. The biggest category is Lithium-ion and the average storage is 6.52.
| Type | Number | Project mean (MWh) |
| Lithium-ion Battery | 167 | 6.52 |
| Lithium Ion Titanate Battery | 2 | 0.95 |
| Lithium Iron Phosphate Battery | 34 | 0.99 |
| Lithium Nickel Manganese Cobalt Battery | 4 | 5.33 |
| Lithium Polymer Battery | 2 | 1.67 |
| Lithium-titanate | 1 | 0.25 |
So how fast do we need Lithium batteries to be deployed in the future?
Finkel’s report predicts that if his preferred option of a Clean Energy Target is adopted then around 40GW of large scale VRE (meaning wind and solar) would be added by 2050. How much backup will each gigawatt require?
Finkel doesn’t say, just like he doesn’t actually say how much electricity will be required in 2050 or what Australia’s population will be.
If you want to make a solar farm deliver 24×7 electricity, then you need 12 or more hours of storage. With a wind farm you might get away with 10. Of, course that amount won’t get you through a week of cloudy windless days, but it’s a bare minimum.
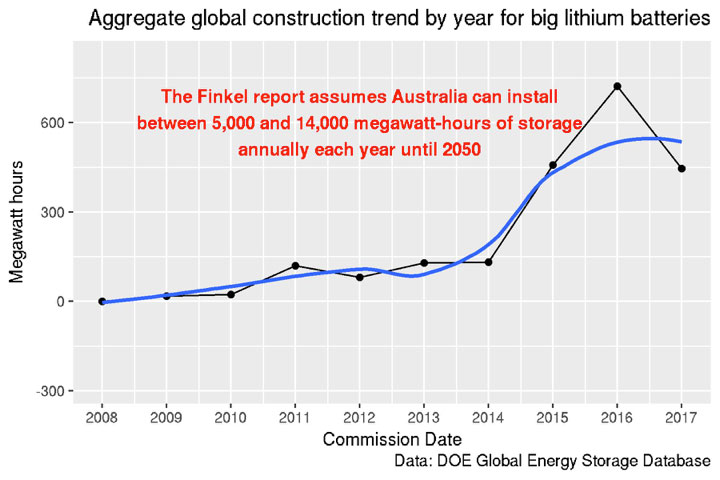
Finkel postulates 40GW of extra VRE and a 10GW reduction in baseload, so he’s not anticipating much of an increase in population. So lets look at the range of 4 to 12 hours of battery backup for each gigawatt, then we’d need to build some 160-480GWh of battery storage in 33 years, or 4.85 to 14.5 GWh per year.
We can’t see the cumulative build rate per year in the above chart, we have to summarise the data first. Here’s a plot with all the battery storage capacity accumulated by year. As you can see, we have just crossed the 1/2 a gigawatt (=500 megawatts) per year.
So if Finkel’s scaled up phone batteries were to do the job, we’d need to increase production rates by at least a factor of 10, and that’s just for Australia.
The problems are obvious. The first is that the big grid scale batteries are not being deployed to backup variable renewable energy plants as Finkel’s plan requires, the second is that he hasn’t considered that there might be serious problems in scaling up battery production.
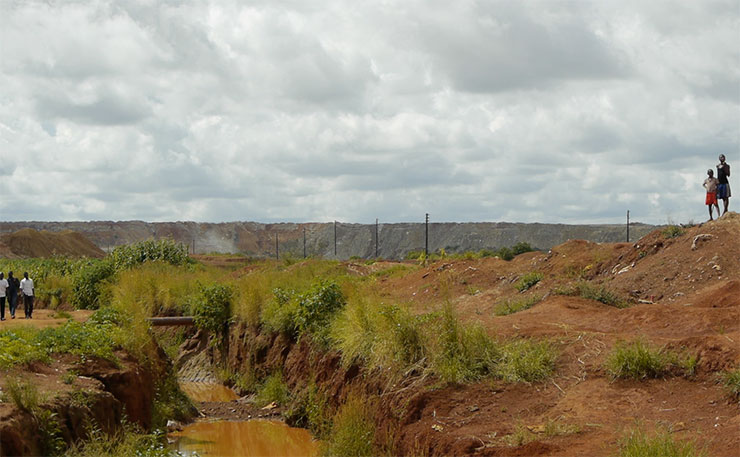
Consider Lithium-ion technology first. These batteries contain about eight times more cobalt than lithium and half the world’s cobalt comes from the Democratic Republic of Congo.
The second critical material requirement is graphite and most of that comes from China where mines and downstream processing are taking a terrible human and environmental toll.
Blood diamonds have been the focus of films and documentaries, but it’s blood batteries that power our phones and bicycle lights. A 2016 Amnesty International Report makes chilling reading but didn’t appear in the bibliography of either Finkel’s report or that of the Jacob’s modelling report.
Again, betting the planet on massively scaling up cobalt production might not be wise or ethical. I’m quite sure that people would prefer to buy cobalt from nice places where children don’t die during mining, but the fact that so much cobalt comes from the DRC doesn’t bode well for the ease of ramping up capacity.
In the past eight years, global cobalt production has doubled, and the percentage of that coming from DRC has increased.
Elon Musk is already running into raw material supply problems with his single battery Gigafactory.
And what about molten salt batteries?
If you built an APR1400 sized solar farm and wanted 12 hours of molten salt storage as backup, then you’d need about 1.6 million tonnes of salt. “Salt” here isn’t table salt, but fertiliser, a mix of potassium and sodium nitrate made in large chemical plants. The global annual production output of this pair is roughly three million tonnes, and we need it to grow food.
Could we scale it up? Certainly, but there will be limits on both the speed and ultimate capacity. Anybody betting the planet on such technology would do well to investigate these before placing their bet.
Ok, so the two biggest types of batteries are non-starters, but what about pumped hydro storage? That is the other storage technology that Finkel mentions as a “prospect”. It’s actually not a prospect, but has been around at scale for decades.
Unlike batteries, the energy storage associated with pumped hydro is big enough to be measured in terawatt-hours (TWh), rather than gigawatt-hours (GWh).
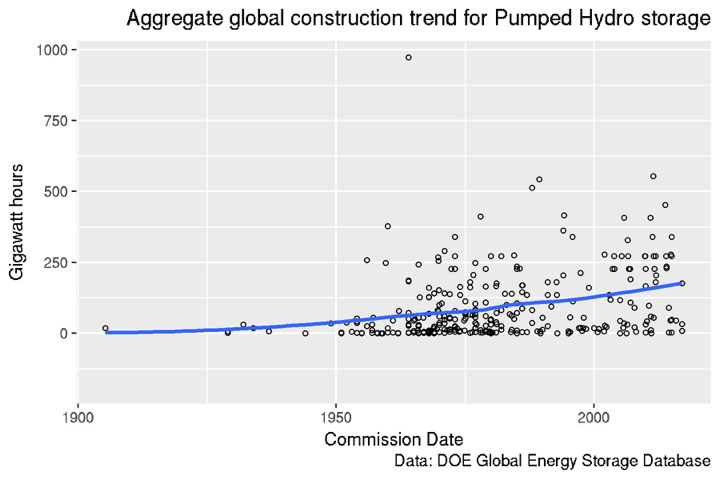
But hydro plants can have serious environmental impacts. Firstly, there is the change of landscape which may mean the loss of large areas of habitat; human or animal. They can also produce considerable amounts of methane. But if conditions are favourable, they can be reasonably benign. Here’s a picture of their global construction over the past century. The points in this plot are individual projects and can often be many gigawatt-hours in energy storage capacity.
But to look at the annual build capacity, we need to plot total capacity added each year. The next graph shows this. Each datapoint is the added capacity (in gigawatt-hours) in that year.
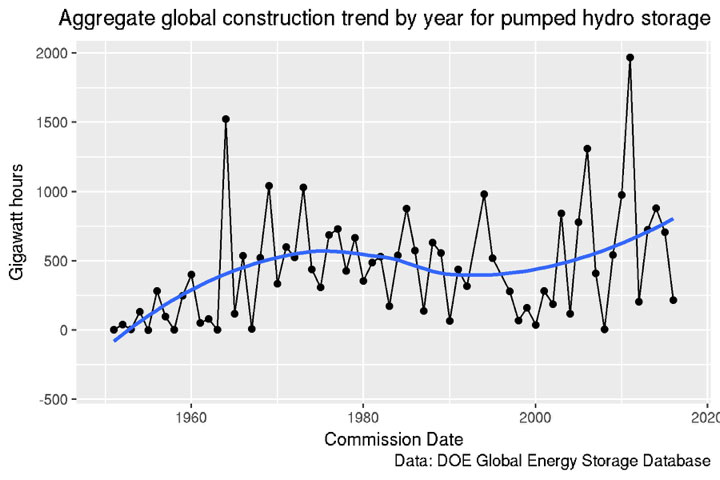
So the annual global growth of pumped hydro is in the ball park of what we need over the next 33 years. But how much have we built in Australia over the past 50 years? The total pumped hydro storage capacity in Australia is listed in the DOE database as 467 GWh.
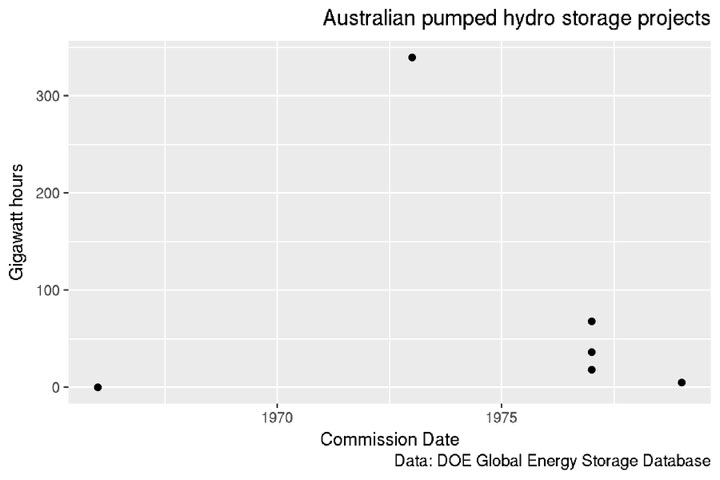
So at the upper end of our estimate (12 hours per GW) we’d need as much again over the next 33 as we’ve built in the past 50. Meaning either another Snowy scheme somewhere, or a large raft of smaller regional dam projects. Is this feasible? Hydro electricity is just making electricity using the force of falling water to drive a turbine. Think about a fountain with a pump. The water just goes around and around. It takes energy to drive the system, it doesn’t produce any.
This is referred to as a closed loop pumped hydro system. It you rig the falling water from your fountain to drive a turbine, you can get back most, but not all, of the energy you used to pump the water to the top of your fountain.
An open loop system doesn’t just recycle the water. It uses the natural flow of a river to supply the falling water which drives the turbine.
In practice, many hydro electricity schemes use natural river flows into a reservoir and also have pumps to recycle some or all of that water back to the reservoir after it has been used. This makes measuring energy capacity a little tricky.
With a closed loop system you can just measure the volume of water in the reservoir and use the distance it falls to calculate the total energy capacity. But if water keeps magically appearing in the reservoir, then this is obviously not right.
In a wet year, you might do no pumping, but during a drought, you’d have to do plenty of pumping. In Australia there is always tension in large hydro electricity systems between wanting water for nature, to fuel natural eco-systems, and water for electricity.
In recent years the emphasis has been on increasing water for environmental flows within economic constraints. A massive hydro expansion would meet considerable environmental opposition if not carefully (which usually means slowly) planned.
It’s incredibly easy to model something and just assume that the market can supply any demand your model throws up.
It’s much harder to examine material supply chains, identify possible bottlenecks and plan according to what is possible.
The rate of scaling of storage technology assumed by Finkel looks environmentally questionable for pumped hydro and simply impossible for anything else.

Donate To New Matilda
New Matilda is a small, independent media outlet. We survive through reader contributions, and never losing a lawsuit. If you got something from this article, giving something back helps us to continue speaking truth to power. Every little bit counts.


