
It’s still ‘all about the baseload’, writes Geoff Russell, in this simple guide to understanding the limitations of energy sources like wind farms.
Renewable-only advocates claim that we can build a reliable, clean electricity system using mostly unreliable sources; like wind and solar power. And of course we can; the theory is simple, just build enough of them.
Coffee shops operate rather like our current electricity system; there are a few permanent staff who are analogous to what are called baseload power stations. Additional staff are hired to cover the busy period(s) and correspond typically to gas fired generators.
The renewable alternative is like running a coffee shop with a crew of footloose narcoleptics who arrive if and when they feel like it and who can nod off with little notice. Would this work? Of course; just hire enough of them.
Any criticisms of renewable plans is typically subjected to execution by slogan: That’s soooo last millennium; baseload is a myth!
I’ve used something like this coffee shop analogy elsewhere, but it doesn’t capture other critical features of electricity sources … let’s begin with the capacity factor.
Capacity factor
When someone talks about a “100 megawatt” wind farm, this refers to its maximum power output when the wind is blowing hard. Energy is power multiplied by time, so if it’s windy for 24 hours you’ll get 24 x 100 = 2400 megawatt-hours (MWh) of electrical energy. But actual output over the course of a year is obviously only a percentage of the maximum possible and that percentage is measured and called the capacity factor; typically about 33 percent for wind.
A rooftop solar system is also labelled according to its maximum output and also has a capacity factor… averaging 14 percent in Australia but only 9 or 10 percent in the UK or Germany.
Nuclear plants also have capacity factors because they usually need to be taken off line every year or two for refuelling. Typical percentages are 90 in the US and 96 in South Korea.
You can’t compare electricity sources without understanding capacity factors. Since the capacity factor of a nuclear plant is about 90 percent and that of rooftop solar is about 14 percent and because 90/14 = 6.429, then you’d need to install 9,000 megawatts worth of solar panels to match the amount of electricity you’d get from a 1400 megawatt South Korean APR1400 nuclear reactor over a year (6.429 x 1400 = 9,000).
Which is more than double the 4041 megawatts installed in Australia between 2007 and the end of 2014.
Matching supply and demand
But 9,000 megawatts of solar panels is still very different to 1,400 megawatts of nuclear, even if both produce the same amount of electricity annually. With 9,000 megawatts of PV panels, you don’t control the output and on any day it will range from nothing at night through to 9,000 megawatts if it’s hot, cloudless and the right time of day.
In contrast, 1,400 megawatts of nuclear power can be adjusted to match demand; turn it down, turn it up.
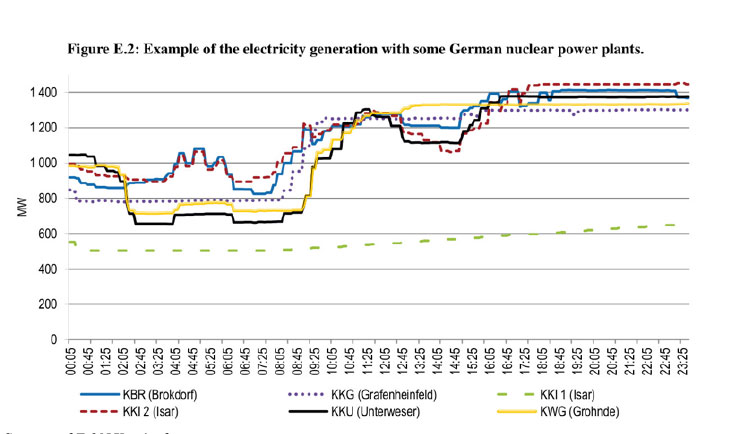
Below is a picture of the output of some German nuclear plants. Note that the output of one plant, KKI 1 (Isar), is pretty constant. That plant began operation in 1979, which is about the vintage of the seemingly immortal but obviously false anti-nuclear claim that nuclear plants can’t follow load; see Margaret Beavis’s recent NM article for a 2015 misstatement.
Brokdorf, on the other hand, is a little newer and has been operating since 1986 and has no trouble ramping up and down. Not only can most nuclear plants load-follow (this is the technical term), it’s increasingly necessary in Germany because of the growth of wind and solar; it’s a thankless task but somebody has to do it!
Now you understand why it’s silly to do what non-technical journalists like Bernard Keane have done, and compare costs per kilowatt of solar with those of nuclear without understanding the capacity factor; let alone grid costs or load-following.
But the capacity factor is also important for another deeper reason and it will take us back to that coffee shop.
First, imagine a small city with a constant electrical demand of 1,000 megawatts and a wind farm supplying, on average, 333 megawatts. Assume the rest is supplied by gas. Given the capacity factor of wind, we can infer that the peak output of that wind farm is about 1,000 megawatts.
What happens to excess electricity?
Now consider what happens if you triple the size of your wind farm.
Since you now have (a maximum of) 3,000 megawatts of wind power, you’ll be averaging 0.33 x 3,000 x 24 megawatt-hours (of energy) per day; which is 100 percent of demand; excellent.
But what happens when it’s really windy? The output is then triple the demand; so, without storage, that electricity gets dumped.
Dumping electricity on your neighbours isn’t a nice thing to do if they don’t need it at the time.
Wind farms, like any low capacity factor unreliable electricity source, are fine when they are a small contributor to a large grid, but not so fine when their surges are large relative to the demand on the grid; then they become a veritable bull in a china shop.
How does this look in coffee shop terms? If you run your coffee shop with a large bunch of narcoleptic staff, then some of the time they’ll all be awake and rearing to go, but there’ll be few customers and your staff will be twiddling their thumbs at best and getting in each others way at worst.
But perhaps the analogy is broken? Instead of a single wind farm, we could have multiple farms spread over a huge area and interconnected so that the wind must surely even out; never blowing hard (nor totally calm) at all sites. Certainly this sounds plausible… but what actually happens?
John Morgan looked at the Australian data on wind power in an article a couple of months ago on bravenewclimate.com.
In the 12 months to September 2015, Australia had 3,753 megawatts of wind power across the National Electricity Market (which excludes WA which isn’t connected) and the daily average output ranged from 2.7 percent (101 megawatts for 24 hours) to 86 percent (3,227 megawatts for 24 hours).
This isn’t so different from what would happen with a single 3,753 megawatt wind farm. So despite expectations, there were times when it was pretty windy almost everywhere and other times, including runs of multiple days, when it was pretty damn still almost everywhere.
The overall capacity factor was measured at 29 percent. So despite expectations, many wind farms, even in a big country like Australia, aren’t that much different to one very big one. And you really do have to worry about being becalmed.
I argued in my last New Matilda article that wasting battery capacity papering over the deficiencies of wind and solar will reduce our ability to solve our clean transportation problems.
Copper plates and real networks
Clearly if many wind farms are intended to even out supply, then they need to be interconnected.
A study commonly cited in Australia supporting the feasibility of a 100 percent renewable system is that of Elliston, Diesendorf and MacGill.
One assumption of that study was that electricity can flow freely from where-ever it is generated to where-ever it is needed.
This is called the “copper plate” assumption; it assumes the continent is just one massive copper plate conducting electricity everywhere at high speed.
But real interconnectors have to be built, and how much connectivity do low capacity factor sources need? A European study found that the grid capacity to transfer electricity under a 100 percent renewable scenario needs to be ramped up by between 5.7 and 11.5 times; depending on the quality of service required.
The “flow freely” assumption occupied just one sentence of the Australian study but conceals a wealth of problems and complexity. The EU goal is that member countries provide interconnection capacity equal to just 10 percent of installed capacity… by 2020.
The need for extra national interconnections is mirrored internally within the larger countries by the need for extra internal interconnections. In Germany this is being implemented under the Power Grid Expansion Act (EnLAG) involving 3,800 kilometers of new extra-high voltage lines.
These lines aren’t being built without protest. The path of least resistance will be wildlife habitat; to avoid concerns both real and imagined over reducing property prices and health risks.
To extend the coffee shop analogy to cover distributed wind farms, we move from a single shop to a WindyBucks Chain of shops spread over the country.
The European study implies that making this work will require not just extra staff but a fleet of lightening fast taxis to shunt the staff around from shop to shop. This is so that when we have too many baristas in Cairns, we can shunt them down to cover for those having a kip in Hobart.
Again, the theory is simple; just add another layer of duct tape until it holds together.
Markets, profits and planning
There’s one not so obvious way in which the coffee shop analogy breaks down. Coffee shop staff get paid by the hour, not by the number of coffees they make; but users of electricity pay for what they use, not for what is generated.
Does anybody want to pay 10 times the going rate for a coffee just because there happen to be 10 grinning baristas twiddling their thumbs behind the Espresso machine?
If not, then consider what happens to electricity prices during our imagined tripling of wind capacity. Remember, we started by assuming wind provided about 30 percent of electrical energy, so when we triple the number of farms and the wind is blowing pretty strongly everywhere, they’ll be generating about triple what we want.
In a free electricity market where suppliers bid for electricity, the price will dive. So while it’s very profitable to build a wind farm when total wind energy is less than the capacity factor, it soon becomes very unprofitable because nobody wants your product; you also create a mess that somebody has to clean up by building extra grid magic to handle power surges.
Why didn’t people see this coming a decade ago? Probably somebody did, but they were “Sooo last millennium”!
This market failure gets worse and worse as wind penetration exceeds the capacity factor. Our whole climate mess can be viewed as one massive market failure; which is part of why I’m not a fan of using markets to solve problems of consequence.
People who build solar farms, hospitals, nuclear plants, bridges, aeroplanes, submarines, battery factories and any other bloody thing are unanimous in their use of planning; in contrast, people who love markets are people like politicians, lawyers and market traders who rarely build anything that doesn’t come in an Ikea box.
This article has tried to explain as non-technically as possible some of the problems that arise as penetration rates of intermittent electricity sources rise. I’ve used wind as a concrete example, but the same problems occur with any low capacity factor sources.
It may help people understand why Germany is burning half of her forestry output for electricity to provide some level of baseload power amid the renewable chaos. She could be, and should be, maximally expanding forests to draw down carbon, but instead, her logging and fuel crop industries are booming.
But the German use of baseload biomass to paper over renewable deficiencies isn’t just a love of lumberjacks and hatred for wildlife – when AEMO (Australian Electricity Market Operator) reported in 2013 on the feasibility of 100 percent renewable electricity, both her scenarios were “Sooo Last Millenium” and postulated a baseload system underneath the wind and solar components; either biomass (Log, Slash, Truck and Burn) like the Germans, or geothermal (ironically driven by heat from radioactive decay within the earth).
Technical readers should consult John Morgan’s articles a and b in addition to the various papers and studies he mentions.

Donate To New Matilda
New Matilda is a small, independent media outlet. We survive through reader contributions, and never losing a lawsuit. If you got something from this article, giving something back helps us to continue speaking truth to power. Every little bit counts.


