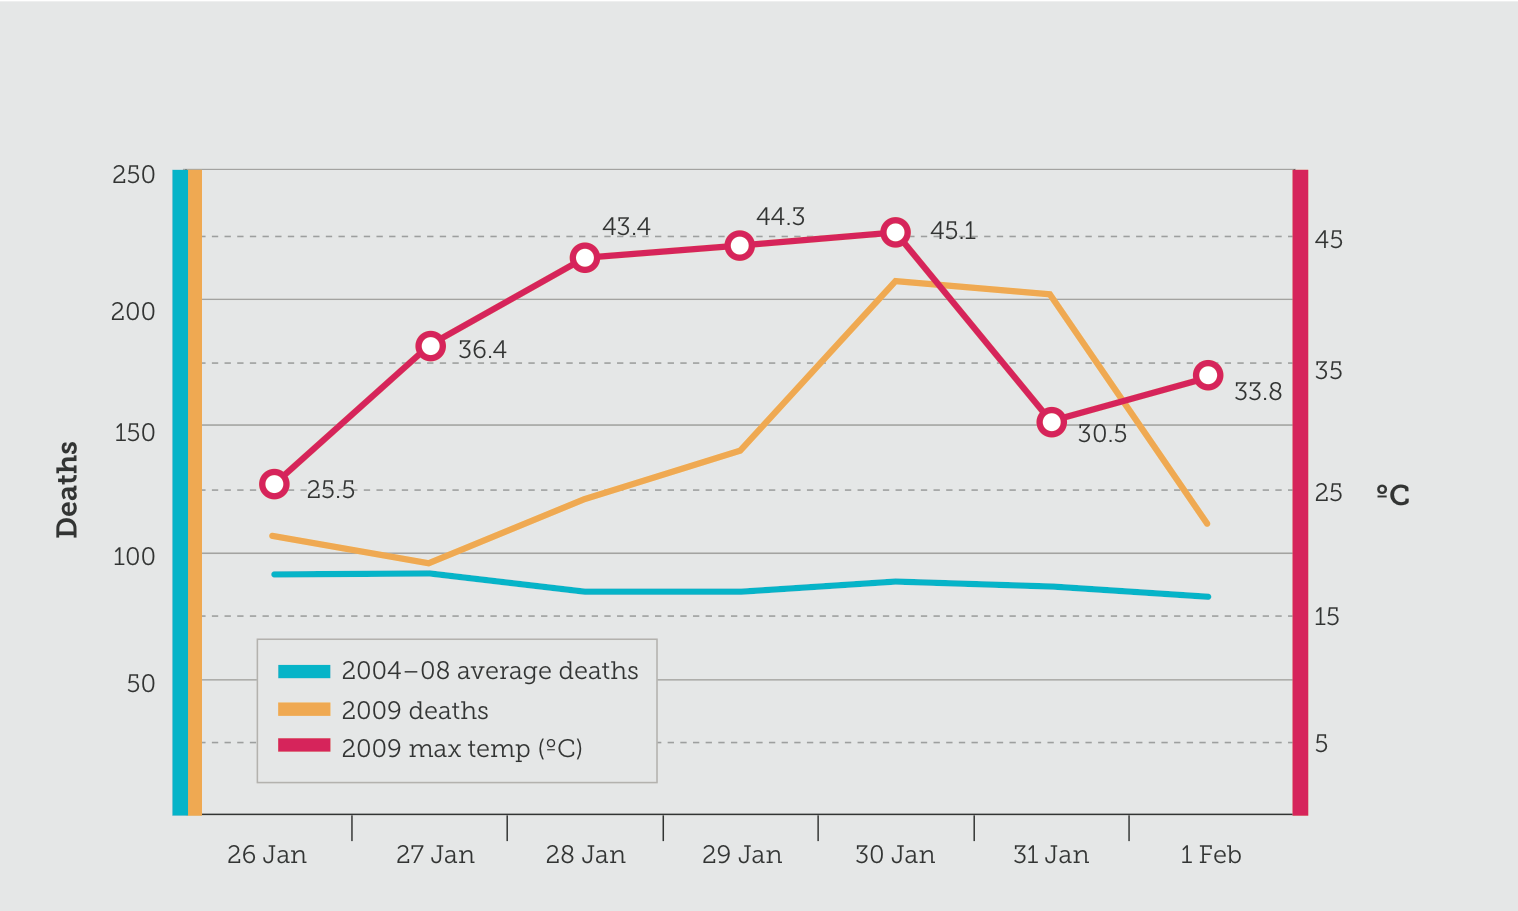
Mortality and temperature during the 2009 Melbourne heatwave. The Graph shows the relationship between prolonged periods of high temperature and death rates. (IMAGE: Climate Council)
Donate To New Matilda
New Matilda is a small, independent media outlet. We survive through reader contributions, and never losing a lawsuit. If you got something from this article, giving something back helps us to continue speaking truth to power. Every little bit counts.


