For more than a year Christopher Pyne has asserted that school education spending has risen by 40 or 44 per cent over the last 10 years. This is his lead-in to a claim that increased funding has not resulted in improved educational outcomes and that therefore, presumably, it is futile to spend even more money on school education. He used that figure again today, commenting on Australia’s poor showing in the Program for International Student Assessment results.
He has never clarified whether he is referring to all school spending (which includes parental contributions in the form of fees) or only to that part funded by governments, but in a speech he gave to the Sydney Institute in 2012 there is a footnote reference to the 44 per cent figure. It comes from a Grattan Institute study, which compared two snapshots of school funding, in 2001 and 2009, and it refers only to government funding.
To Pyne’s credit, he has not used the usual political sophistry of failing to account for inflation – the sophistry that leads to absurd claims about record government debt racked up by Labor. The figure is in “real” (inflation-adjusted) terms, and it checks out reasonably well with time series data on public expenditure produced by the Australian Bureau of Statistics (ABS).
But there are three reasons why Pyne’s use of that figure vastly overstates the growth in public resources being devoted to school education.
First, his use of 2009 as the end point of comparison. That was an unusual year, for it was at the peak of the Commonwealth’s stimulus payments in response to the GFC, which included spending on the Building the Education Revolution program. That program was mainly in the form of capital grants for halls, libraries and classrooms, so in theory should not show up in reports on recurrent funding, but as any businessperson knows, a capital expenditure program always carries a significant component of recurrent spending at the same time.
By 2011-12, however, the spike had passed and spending was back on trend. Using the same method of inflation adjustment as used by the Grattan Institute study, the growth in government funding to schools over the ten years to 2011-12 was 26 per cent. If, however, we use 2010-11 and 2009-10 as the ten year end points, we find growth of 40 per cent and 49 per cent respectively – aligning with Pyne’s 44 per cent.
That is not a criticism of the Grattan Institute study. They were using what data was available early last year and, in any event, the study was not primarily concerned with funding. But it is a criticism of Pyne’s continued use of data which would be easy for his office to update.
The second problem with his figure is that it ignores the growth in student population – around 8 per cent over the ten years to 2011-12. His claims are rendered meaningless if spending is distributed over a larger group of students. Over that period, spending per student has risen by only 17 per cent.
A disproportionate portion of that growth has been in higher years of schooling – years 11 and 12. These years, for reasons well-known to any young person or parent, are more resource-intensive than earlier years.
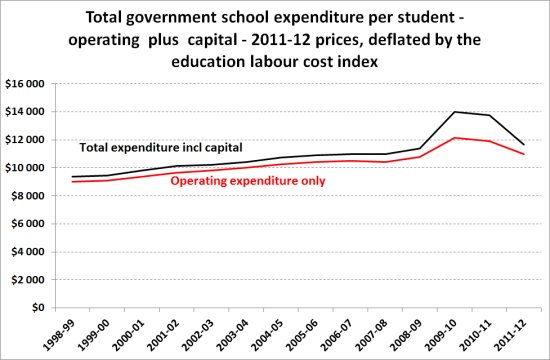
The third overstatement is in the method of inflation-adjustment in these figures. The figure used by the Grattan study is known as the “GDP deflator”, which is a measure of price rises across the whole economy. School education is intrinsically labour-intensive and although teachers’ pay has lagged somewhat behind the pay of business executives, they have done a little better than general inflation. If we use the ABS series on education labour costs to strip out the effects of inflation, we find spending per student has grown by a more modest 14 per cent over this period. That’s pretty well in line with our per-capita economic growth during that same period and if we have been spending 14 per cent more on cars, housing, clothing and food, isn’t it reasonable that we should also be spending 14 per cent more on schooling?
In short, Pyne’s 44 per cent comes down to 14 per cent when proper, orthodox analysis is applied, as seen in the graph below, which clearly shows the 2009 spike and subsequent reversion to trend. The factual basis of Pyne’s argument – that we have been spending much more on schooling – is flawed.
Even if he could establish that spending on education has grown strongly, and that it has not produced better results, it would do nothing to support his argument that we should keep the existing school funding model and spend no more.
In fact, it is an indictment of the present funding model.
If public spending is not producing the outcomes we seek, the question to ask is whether it is being spent wisely. Pyne offers no explanation, leaving us to believe that any boost in education spending is futile. But the figures provide a strong clue, in support of the Gonski findings. Over the 10 years to 2011-12 Commonwealth funding to school education, which is mainly provided to private schools, rose by 61 per cent, while state government funding, almost directed to public schools, rose by only 8 per cent.
The most compelling explanation for disappointing outcomes is that money has been spent in the wrong schools – in private schools, where the marginal benefits of spending on those who are already well-endowed are far less than the marginal benefits of spending on the disadvantaged. That’s the fundamental economic message from Gonski.
(Those who have an appetite for financial analysis will find an Excel workbook of data, graphs and calculations on my website here.)
Donate To New Matilda
New Matilda is a small, independent media outlet. We survive through reader contributions, and never losing a lawsuit. If you got something from this article, giving something back helps us to continue speaking truth to power. Every little bit counts.


