

When America sneezes, the world catches a cold. Or so they say. But what happens when the US throws up all over itself, and then has to be rushed to hospital to get its stomach pumped? There’s a bus trundling down the highway, or maybe a bull, but whatever it is, it’s about to hit the US economy. Rita Bodrina explains.
The US economy is failing. Interest rates are high, and AI companies are not about to innovate us out of a crisis.
Within the American financial circles, there is a persistent belief among its leading voices in the ‘invincibility of the US economy’. But then again, they do say: ‘It’s difficult to get a man to understand something when his salary depends on him not understanding it.’
The Vice Ensnaring Us All
In the midst of what can be called a super bubble on the brink, the US stock market stands detached from reality. Contrarian investors have started calling bluff on the sustainability of the perma-bull stock prices we are seeing.
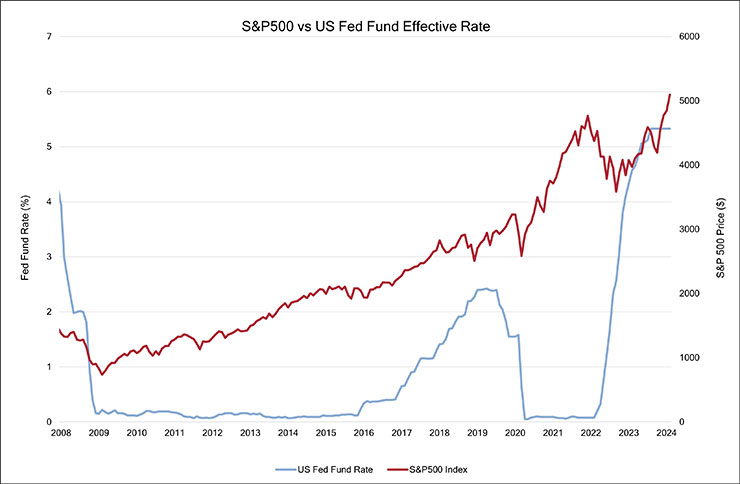
In 2022, stock prices dropped due to a sudden surge in interest rates. By March of 2023, we started seeing price volatility amidst a US banking crisis. But then the switch flipped and by the fourth quarter of 2023, stock markets started surging to record highs.
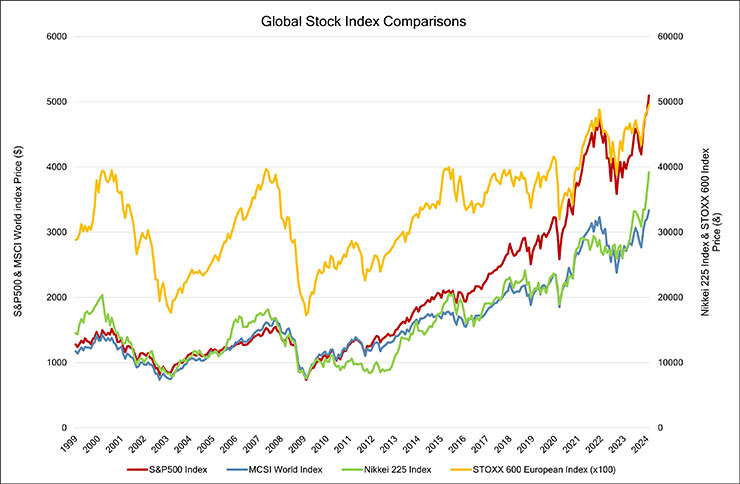
In January 2024, the S&P 500 (an index representing the largest companies listed on the US Stock Exchange), reached a two-year peak. By February, it raced past 5,000 points. On the same day, the STOXX 600 European stocks index set a new record, as did the Japanese Nikkei 225 and the MSCI World indexes. The whole world, it seems, was on the up and up.
Then what’s the big fuss? Everything is going so well – sit back and enjoy it, dammit!
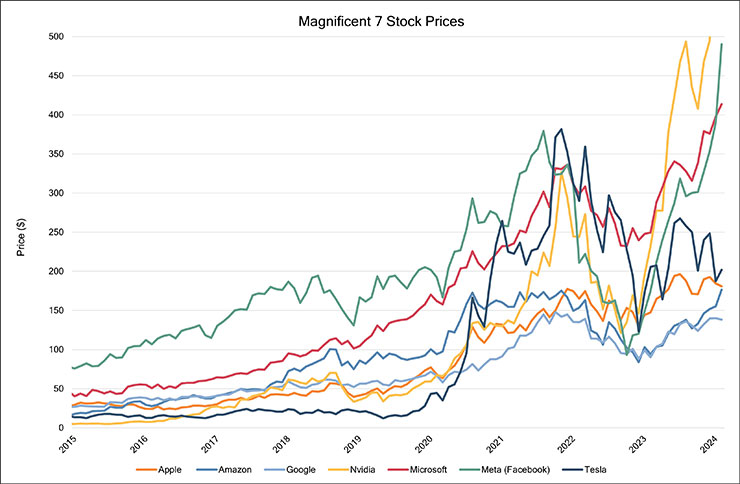
The Magnificent Seven
Is the current growth sustainable? Not according to renowned investor Jeremy Grantham. At the Exchange 2024 conference in Miami this February, he drew parallels between the current stock market boom and the financial madness that preceded the Wall Street crash of 1929 and the resulting Great Depression, as well as the collapse of the global economy during the early 2000s dot-com crisis.
It’s not hard to agree with Grantham, particularly given that the significant surge in the S&P 500 index is being primarily driven by seven tech giants: Apple, Amazon, Alphabet, Meta, Microsoft, Nvidia, and Tesla.
These stocks rose an average of 105% in 2023, led by Nvidia. This concentration poses a significant vulnerability for the US market. If any of these stocks were to falter, it would have far-reaching consequences for the entire market.
Numbers Tell the Best Horror Stories
So, the market is doing really, really well and it’s because of a few stand out stocks. Could it be that these stocks are not overvalued, but rather a reflection of companies flourishing on the back of innovation and productivity?
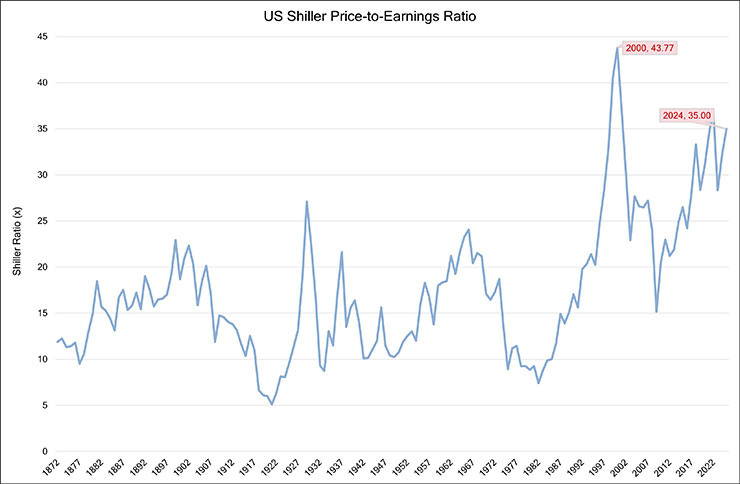
To test this, experts look at the Shiller ratio – the higher the level, the more overvalued the market is considered. Historically, this indicator reached its peak at 44x during the dot-com bubble in 1999, and at 32x in 1929 before the Great Depression. Currently, the indicator stands at an extremely high 35x, representing the top 4% of its historical range.
For comparison, at the end of 2023, the ratio for the Russian MOEX market was 5.7x (vs US 28.3x).
So why did the US suddenly become over-priced in 2023? The market wasn’t exactly thriving, and then suddenly prices rose so much that we are now discussing market collapse. At the time stock prices were falling, and they would have plummeted even further if it weren’t for the rude interruption of the rapid development of artificial intelligence earlier that year, which changed the trajectory of the entire stock market.
Sublimated Variables
This seemingly detached-from-reality growth could theoretically persist if the ‘Magnificent Seven’, continue to perform well. But corporate profits overall are stagnating.
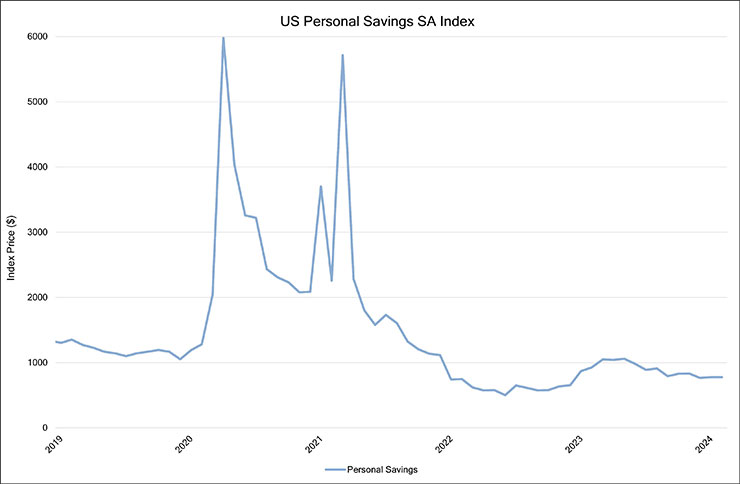
The primary driver of profit growth since Covid – high consumer demand – is already on the decline. This decrease is partly fuelled by consumers exhausting a good chunk of their savings, as economists at the Federal Reserve have already pointed out.
If consumers tend to spend their surplus money on discretionary goods, then we can test this theory by taking note of what companies in this space are doing and saying.
Wayfair (furniture) plans to lay off 13% of its staff due to weak performance, while Levi Strauss (clothing) will cut 10–15% of its workforce. Mondelez (confectionery) predicts revenue growth to be 3–5% compared to 14% in 2023. And that’s only naming a few.
The US corporate growth between 1980 and 2019 can be explained by the decline in interest and corporate tax rates.
Firstly, during this period, American companies experienced a significant decrease in the interest rates they got on their loans, dropping by approximately 83% from the beginning of 1980 to the beginning of 2019.
Secondly, during the same period, the effective corporate tax rate in the US also very much declined. From 1989 to 2019, the corporate tax rate of American companies fell by approximately 55%. So, firms were paying less money to the government, while their profits have been growing.
Can we, at least, expect somewhat of a replication of these conditions moving forward? No.
The era of low interest rates has ended, with the risk-free interest rate about double what it was in 2019, with no assurance of a return to 2019 levels; and while tax policies may change post-US election, the global trend is a shift towards higher, not lower, corporate tax rates.
If Tomorrow Never Comes Everything is Free
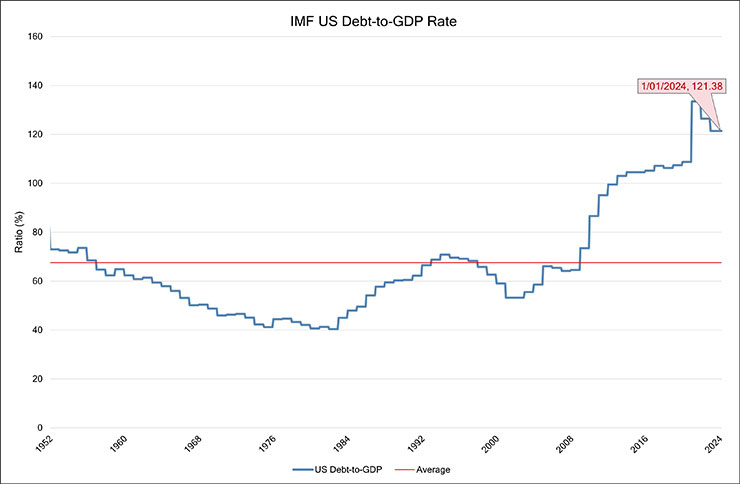
However, these anticipated tax increases are not poised to decrease US government debt. In fact, projections suggest a significant increase in debt relative to GDP, with the current ratio sitting at 121%, and set to climb to 166% in 30 years.
Said another way, the US has more debt than GDP. “Help! The debt load is so heavy that it squashed my GDP.”
There is a real fear of a looming debt spiral in the US, and avoiding it will take a miracle. High debt-to-GDP not only erodes any remaining investor confidence, but also limits government flexibility in responding to economic shocks, crowds out private investment, and increases the risk of default.
All governments default the same way: deny, deny, deny, then bite the bullet and default, or continue denying. Of course, that’s not the only option, you could see:
- Corporations embrace deflation, with all the associated pain;
- Implement inflationary measures;
- Engage in conflict or war;
- Come up with some new innovation and grow out of your debt crisis.
My bingo card has two (arguably three) already crossed off.
Serendipity Will Play Its Part?
Martin Wolfe, editor of the Financial Times, points out: “In 1816, the net public debt of the UK reached 240 per cent of gross domestic product. This was the fiscal legacy of 125 years of war against France. What economic disaster followed this crushing burden of debt? The industrial revolution!”
Innovation can create GDP, this is true. But hoping for some wildly successful event to happen so that we find ourselves with a new economic engine… well, that’s a bit ‘over-optimistic’, also known as ‘delusional’.
Humanity has greeted every significant invention with incredible enthusiasm – today, this invention is AI. So people are racing to ‘buy, buy, buy’, even when we don’t have a clear user case for it.
Some companies may be experiencing productivity growth where AI tools are utilised, but it’s important to temper expectations, as this technology is still young.
To achieve any kind of success or increased prosperity, any policy which prefers ‘apparent success’ to ‘real progress’ must be abandoned.
Historical experience has shown us that crisis in the West (like, say, the great ‘stagflation’ of the 1970’s) leads to extreme decline in the standard of living, affecting not just the United States.
How would you fare if your standard of living dropped by 40-50%?
Look at the signals and make your own judgements.
Donate To New Matilda
New Matilda is a small, independent media outlet. We survive through reader contributions, and never losing a lawsuit. If you got something from this article, giving something back helps us to continue speaking truth to power. Every little bit counts.


